E9.2 UBE performance issue

shivam

Active Member
we have a custom ube in E910 which completes in 30 minutes where as the same ube runs for 3 hrs in E920.
how ever same set of records in both environments can anybody please suggest on the same ?
 
Are you missing a custom Index from the 9.2 table?
verified the business view and others it was just a custom ube moved from 910 to 920 .

for same set of records in 910 it completes in 30 min where as in 920 it takes 2.5 hrs

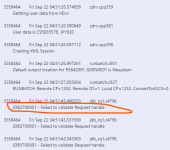
when verified the logs it just says " 1695643221473.png

the same error stays for almost 2 hrs in log file. hmmm
 
Custom index mentioned by @Larry_Jones would perhaps be something your DBA handled on the database side rather than from the JDE Dev side to increase performance. We're assuming 910 and 920 are running off of different databases?
 
we have a custom ube in E910 which completes in 30 minutes where as the same ube runs for 3 hrs in E920.
how ever same set of records in both environments can anybody please suggest on the same ?
Are you on new hardware in 920, or using the same servers?
 
Oracle makes a really good tool for analyzing performance called "Performance Workbench". Turn on debug logging for the UBE and then use "Performance Workbench" to parse the debug log and often it will help you narrow down the area of the code where the bottleneck(s) are.
 
If it truly is only one UBE, I would suspect an index or indexes were changed by the upgrade. Find out what tables the UBE is hitting and start your analysis there.

index changes verified and as said its just a custom UBE . as per the log not known why the Table level calls are doubled and processing time is taking more on server when compared to local FAT .
 
index changes verified and as said its just a custom UBE . as per the log not known why the Table level calls are doubled and processing time is taking more on server when compared to local FAT .
What do you mean "index changes verified"?
 
Another possibility: If your custom UBE is using Event Rules to loop through tables, and you're using the Select/Fetch Next statements, make sure the Select and the Fetch Next statement are tied to the same index. Especially important if you have nested fetch loops.
 
"Failed to Validate request handle" really looks like an attempt to reuse a table handle after a JDB_CloseTable call. Perhaps in the previous release, you were lucky and the memory still pointed to the same place after close but it had not been cleaned up yet by the JDB layer, while in the new release it has.

I'm assuming old and new tools releases are also different.
 
index changes verified and as said its just a custom UBE . as per the log not known why the Table level calls are doubled and processing time is taking more on server when compared to local FAT .
Hello Shivam,

Best option to understand the performance issues is to verify it thru Performance Workbench tool - capture logs only for 5 mins or less for both good and bad scenarios and then compare the call stack, timing gaps and all the other options available. Also, Try performing table stats with the help of DB team to see - if that helps.

Thanks
 
Back
Top