JohnDanter2
VIP Member
Hi all
Just thought I'd post up my steps I did to make a JET page to render E1 data into graphs.
At the end I have added my template for a Pie and Bar chart.
The trick is to fathom that all the dashbaords are just composite pages made up of 'tiles' that point to a new type of E1 APPL form. (You will find loads on your system ending in X - they contain no code just a pointer to an E1 page)
The form type is External App and javascript in the dropdown. And then point to your new E1 Page. The new E1 page (or graph) is then just zipped javascript to make the graph.
Got it? Cool")
On we go
I downloaded Oracles E1JETDeveloper_EnvironmentAndExamples_V9 (UDO_9.2_10454) and based my pie chart on the attached zip (Ten Most Requested Items - P46270 from the warehouse manager dashboard) and based my bar chart on Backlog Number of Requests E1P_1607070006JDE, also in the same dashboard
Me and our local java geek have added some cool features not in the templates, such as displaying the query name and adding totals to the legends rather than a % of the pie. We also changed colour pallets to show suggestions in error as red and good in green etc
So here are my steps and I've added the 2 javascript files for the pie and bar chart together with all my comments for my and your sanity.
So you copy and existing folder and replace what you need in E1AISCalls.js only. Do not touch the other files!!!
Test it in JDeveloper (providing you updated the e1pagehelper.js to aim at your AIS server and open/start your own local server)
When you have made your javascript files, you zip the following 3 E1AIScalls.js home.html and main.js
and upload the zip into the E1Page, add it to a Composite Page as an application P55nnnnX and your form name and get CNC to refresh your AIS cache and bin your web browser cache.
Voila a graph
Also note that you need to develop the blank pages and the P55nnnX APPL and the main driver APPL and get them deployed to thin DV before you start

How to see the JET graph on your composite E1 Page. You add an APPL tile (P55nnnX) which is actually an external form pointing to the E1Page which contains the uploaded zipped java (3 files)

If you have any questions, please ask
Thanks and I hope this helsp the community make more of these cool graphs and dashboards
John
Just thought I'd post up my steps I did to make a JET page to render E1 data into graphs.
At the end I have added my template for a Pie and Bar chart.
The trick is to fathom that all the dashbaords are just composite pages made up of 'tiles' that point to a new type of E1 APPL form. (You will find loads on your system ending in X - they contain no code just a pointer to an E1 page)
The form type is External App and javascript in the dropdown. And then point to your new E1 Page. The new E1 page (or graph) is then just zipped javascript to make the graph.
Got it? Cool
On we go
I downloaded Oracles E1JETDeveloper_EnvironmentAndExamples_V9 (UDO_9.2_10454) and based my pie chart on the attached zip (Ten Most Requested Items - P46270 from the warehouse manager dashboard) and based my bar chart on Backlog Number of Requests E1P_1607070006JDE, also in the same dashboard
Me and our local java geek have added some cool features not in the templates, such as displaying the query name and adding totals to the legends rather than a % of the pie. We also changed colour pallets to show suggestions in error as red and good in green etc
So here are my steps and I've added the 2 javascript files for the pie and bar chart together with all my comments for my and your sanity.
So you copy and existing folder and replace what you need in E1AISCalls.js only. Do not touch the other files!!!
Test it in JDeveloper (providing you updated the e1pagehelper.js to aim at your AIS server and open/start your own local server)
When you have made your javascript files, you zip the following 3 E1AIScalls.js home.html and main.js
and upload the zip into the E1Page, add it to a Composite Page as an application P55nnnnX and your form name and get CNC to refresh your AIS cache and bin your web browser cache.
Voila a graph
Also note that you need to develop the blank pages and the P55nnnX APPL and the main driver APPL and get them deployed to thin DV before you start
| How to compose a JET page | ||||
| https://support.oracle.com/epmos/fa...&_afrWindowMode=0&_adf.ctrl-state=ytums9450_4 | ||||
| Setup JDeveloper | ||||
| https://docs.oracle.com/en/applicat...#ConfiguringandTestingtheOracleJETPageLocally | ||||
| E1 External Form APPL P55nnnnX | ||||
| These APPLs are a new type of E1 form type and are setup to be External Forms. they contain no code, just a pointer to the E1PAGE and static test that can be used as axis and headers with the ability to usre language overrides | ||||
| Create compoite Page | ||||
| Create CMP CUST page and add the graph tiles as a pointer to the P55nnnnX APPL and form. So when the CMP page runs the P55nnnX APPL the javascript wiill run to render the graphs. Javascript is completed and uploaded later | ||||
| Create or use E1 APPL or BSVW to gather data | ||||
| When you create the graphs javascript it use AIS calls to either run a DATA_SERVICE or a FORM_SERVICE | ||||
| The difference is one runs over a BSVW only and bypasses an E1 form whilst the latter still uses the BSVW but also runs any logic you may have in the APPL form, such as PO filters etc | ||||
| This step is very important as iit determnes how easy it will be to render/group data in your graph | ||||
| Example, if your SQL is better than your java then you may want to create a dropped view over an E1 TBLE to SUM or COUNT your data vs doing this in java | ||||
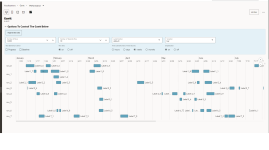
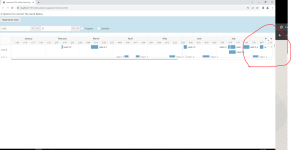
| Create queries over E1 APPL | ||||
| The graphs seem to need a query to generate data. It is worth noting that the graph will use your UDO preferences first (F98950) if none found it uses the first query for the form alphabetically | ||||
| Copy a PIE or BAR javascript | ||||
| Copy the 3 files, AISCall.js, main.js and home.html | ||||
| Start working your way down through the javascript taking care to change the variables and parameters you need to make your new graph from your datasource (E1 APPL and BSVW/TABLEs) | ||||
| function initPage(ko, self) | ||||
| This functions sets up the type of graph (bar pie etc), titles, colour pallets and the E1 APPL BSVW where to obtain data from. | ||||
| function jetTranslations(self, translatedArray) | ||||
| If you need languages etc then you woukd use this section to get E1 overrides from the P55nnnX APPL. My example does not use this, Oracles do | ||||
| function jetdrillTitle(self) | ||||
| This is needed to enable the user to drill into the E1 APPL that obtained the data from JDE | ||||
| function jetdrillData(self, ui) | ||||
| function getE1Data(self, callback) | ||||
| This code is a function to get E1 Data and the name listed must must the follwoing function to get the data. In that function will be the AIS call | ||||
| function getItemCount(self, callback | ||||
| In this function we create the AIS call to the form to suck back the payload of data. We specifiy which grid columns we want and also any data aggregations needed | ||||
| We specifiy the payload data variable ot hold the APPLs output. This will be used n the consume data function | ||||
| function compare(a, b) | ||||
| function consumeData(self, response, callBackToHideSpinner) | ||||
| consume actual data after getting Items | ||||
| This is the part that builds the axis data before the final graph push to display | ||||
| function customToolTip() |
How to see the JET graph on your composite E1 Page. You add an APPL tile (P55nnnX) which is actually an external form pointing to the E1Page which contains the uploaded zipped java (3 files)
If you have any questions, please ask
Thanks and I hope this helsp the community make more of these cool graphs and dashboards
John
Attachments
Last edited: