Soumen
Reputable Poster
We are facing an issue with a specific custom ube where the run times would widely fluctuate between couple of minutes to hours. There is no difference between the processing options and data selections of these 2 runs and they are mostly a resubmit of the same UBE by the user. But what would usually take 20 mins would countinue to run till 6-7 hours sometimes. Another version of the same UBE which usually takes 3-4 mins would run down to 20-25 mins sometimes. So almost a 7 fold increase in processing times happening sporadically.
We are currently in the middle of an upgrade and this is a 9.2 (TR 9.2.2.4) system which users are testing. The server is an AS400 server with V7R3 and is currently on the same host as our current production, just different partition. So resource consumption should not be an issue as far as I think and moreover there are not much users currently on the system. I have been monitoring the CPU during the time job runs and have not noticed any spikes.
More importantly the same UBE doesnot behave the same on the current 9.0 production system. So I highly doubt if the code could be an issue here.
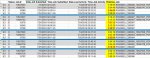
Attached are some of the runtimes between 9.0 and 9.2 for compartitive analysis we did.
I am looking for some ideas on how to narrow down this issue and get to the root cause. Any help would be deeply appreciated.
And yes I have checked the jde.ini setting and Callobj Monitor Working Directory is set to 0.
Thanks,
Soumen
9.0 & 9.2
IBMi V7R1 & V7R3
WebLogic 10g, 12c
P.S:- Sorry on the typo in the subject line... !
We are currently in the middle of an upgrade and this is a 9.2 (TR 9.2.2.4) system which users are testing. The server is an AS400 server with V7R3 and is currently on the same host as our current production, just different partition. So resource consumption should not be an issue as far as I think and moreover there are not much users currently on the system. I have been monitoring the CPU during the time job runs and have not noticed any spikes.
More importantly the same UBE doesnot behave the same on the current 9.0 production system. So I highly doubt if the code could be an issue here.
Attached are some of the runtimes between 9.0 and 9.2 for compartitive analysis we did.
I am looking for some ideas on how to narrow down this issue and get to the root cause. Any help would be deeply appreciated.
And yes I have checked the jde.ini setting and Callobj Monitor Working Directory is set to 0.
Thanks,
Soumen
9.0 & 9.2
IBMi V7R1 & V7R3
WebLogic 10g, 12c
P.S:- Sorry on the typo in the subject line... !
Attachments
Last edited: